Feeding more, or feeding better?
Does a food forest feed people better than a field? We read the studies: calories, protein, micronutrients — where the argument holds, and where it breaks.
It is a sentence you hear on every visit, and one we have said ourselves: “a food forest, nutritionally, is far more interesting than a field.” We believe it because we can see it — fruit, nuts, leaves, flowers, roots, forty species in the same basket, when three plants alone, wheat, rice and maize, supply half of humanity’s plant calories.
Except that a conviction you can see is not a conviction you have measured. So we went and read what research has actually established. The answer is more interesting than the starting hunch: the argument holds, but not at all on the ground where we usually place it.
The only temperate food forest whose weighed harvests have been converted into nutrients
It is neither Dutch nor Belgian: it is Scottish. At Coldstream, Graham Bell — a Scottish permaculture pioneer who died in 2023 — planted an 800 m² forest garden in 1991, and weighed its harvests on an electronic scale, species by species, month after month, from 2011 on. Josefine Nytofte and Christian Bugge Henriksen, of the University of Copenhagen, took seven years of those records for 99 species and published the calculation in Urban Forestry & Urban Greening.
The result: 713 kg of food per year from 800 m², or 8,913 kg per hectare — roughly 5.2 million kilocalories, 123 kg of protein and 105 kg of fat.
Now look at how those 713 kg break down, because this is where it gets instructive. Tree fruit accounts for 53% of the harvested weight. Nuts weigh 9.5 kg out of 713 — 1% of the harvest. And that 1% delivers 15% of the calories and 69% of the fat of the whole garden. A kilo is not a kilo — and that is already this article’s entire thesis.
Show the data Hide the data
| Weight (kg) | Energy (kcal) | Protein (g) | Fat (g) | |
|---|---|---|---|---|
| Tree fruit | 375.4 | 199,781 | 1,118 | 872 |
| Leaves, herbs, fungi | 40.3 | 21,319 | 1,108 | 469 |
| Vegetables | 189.2 | 84,325 | 4,822 | 596 |
| Soft fruit | 98.6 | 48,070 | 1,094 | 657 |
| Nuts | 9.5 | 61,579 | 1,726 | 5,799 |
| Total | 713 | 415,074 | 9,868 | 8,393 |
With a good selection of species, you can produce enough nutrients for eight people per hectare per year. But the curve is too optimistic for the first six years — you have to be more patient.
Those figures line up with others. The authors honestly place their result below the estimates published up to that point, which range from six to ten people per hectare: six to eight in a survey of four practitioners in Denmark and Sweden, up to ten for a food forest designed on paper to optimise both food production and carbon storage. And when Wouter Van Eck showed us, during our stay at Ketelbroek, the “rational” row-based model he developed with the Voedselbosbouw foundation, he arrived at eight people per hectare per year — squarely inside that range, while himself warning that his curve is too optimistic for the first six years.
But read carefully what these numbers say. Scaled to one hectare and set against recommended daily intakes, this garden covers the carbohydrates of seven to nine people, the fat of four or five, and the protein of only three or four. In total energy, it feeds five to seven adults. That is an order of magnitude, not a promise.
Where annuals win, and it has to be said
Now take the hectare next door. Winter wheat yields an average of 8,900 kg per hectare in Wallonia over the past decade, according to the État de l’Agriculture wallonne, the region’s agricultural statistics. One hectare against one hectare, under the same temperate climate — the Scottish Borders are not the Hesbaye, but the order of magnitude is comparable.
Careful with the kilos: on one side fresh harvests, full of water; on the other, grain that is almost dry. That is precisely why we compare in calories and protein, not in tonnes.
Wheat produces five to six times more calories and seven to eight times more protein. This is not a calculation artifact: Wijnand Sukkel, an agroecology researcher at Wageningen, reaches the same verdict in dry matter — an annual monoculture produces at least double what a food forest does. His colleague Martin van Ittersum, for his part, asks to see the evidence: concrete figures, in calories, of what a food forest actually produces.
They are right, and a food forest will not replace a cereal field. Saying so costs us a selling point and gives us a better one: we know what we are talking about.
Three qualifications, though, and they are not excuses. The first: in Europe, most of those plant calories go to feed animals before reaching our plates, which shifts the comparison. The second: the 8,900 kg of wheat assume ploughing, sowing, fertiliser, fungicides and fuel every single year, whereas the Coldstream garden was planted once, thirty-five years ago. Put differently: the field’s score rests on abundant, cheap fossil energy, from the plough to the combine. We are betting that cutting fossil fuel use to the bare minimum will be one of the defining challenges of the coming decades — and on that horizon, a food-producing system that needs almost none of it holds a value the table does not show. It is a bet, not a measurement: we give it to you as exactly that. The third, and for you the most important: Coldstream was never designed for calories. A forest garden designed for energy — with chestnuts, walnuts and hazels given pride of place — narrows the gap. That is the whole point of the perennial staple crops studied by Maayan Kreitzman.
And while we are at it, we may as well say what works against us too. Labour first: in the same interview, the Wageningen researchers point out that per hectare, an orchard demands hundreds of hours of work where a cereal demands about a dozen — a food forest harvest is manual, scattered and drawn out, and it is its heaviest cost item. Time next: Coldstream is thirty-five years old, and your forest garden will take six to ten years before producing seriously — a British survey of a very young food forest gives 230 kg per hectare over its first three years, against 1,300 for annual vegetables on the same ground. Nobody should sell you anything else. Season last: grain keeps for years, fresh fruit for days. A food forest that feeds you in March is a food forest whose nuts have been dried and part of whose harvest has been jarred and lacto-fermented.
Where the ratio flips: nutritional density
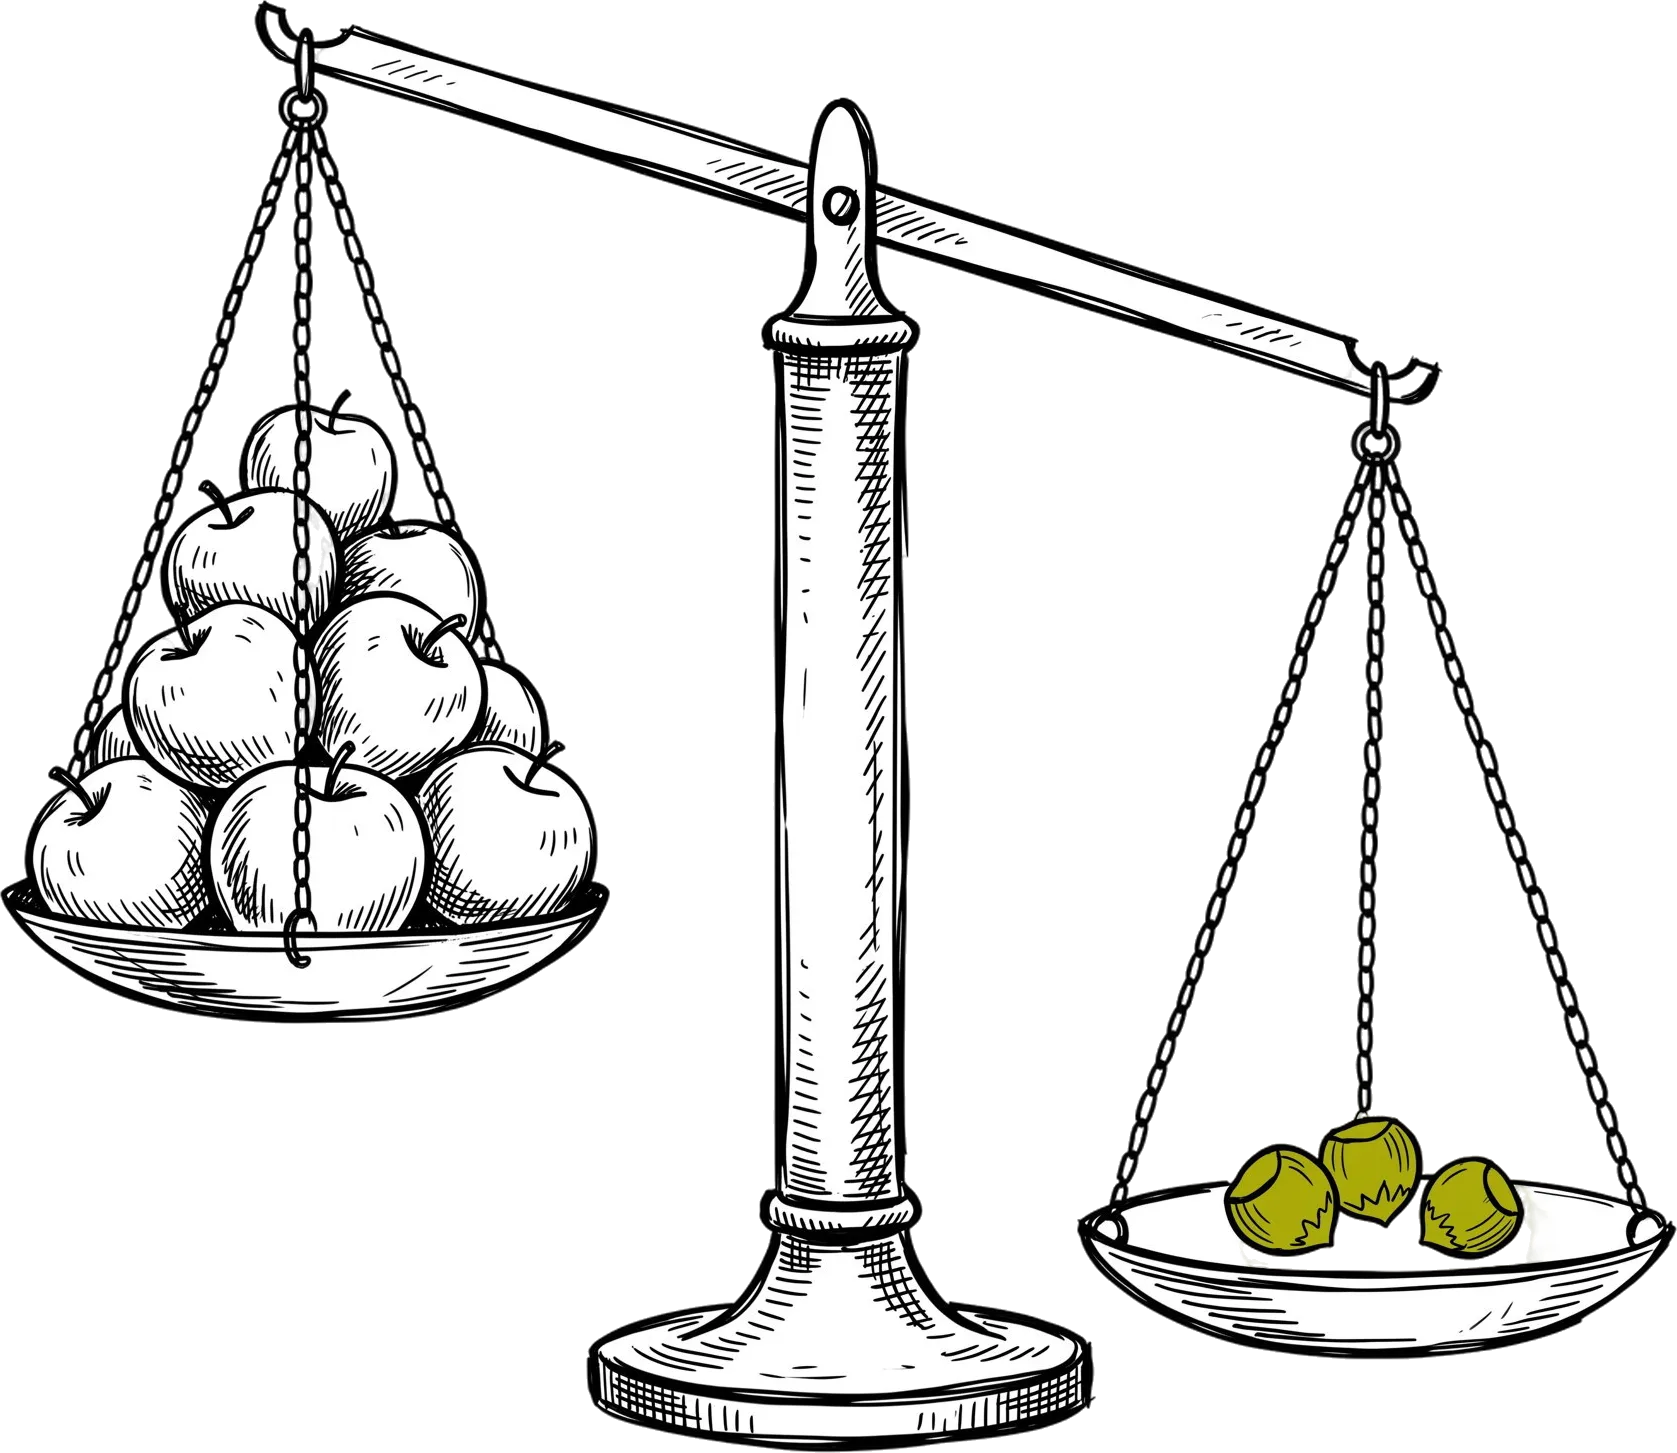
A calorie is not a nutrient. And note that the question changes scale: a country counts in calories per hectare, but your plate is bounded — around 2,000 kilocalories a day, whatever you eat. At the scale of the plate, the real question is no longer how many calories come off a hectare, but what each calorie carries with it. That is precisely where the literature flips.
The reference synthesis is by Eric Toensmeier, Rafter Sass Ferguson and Mamta Mehra, published in PLOS ONE in 2020: 613 cultivated perennial vegetable species, 107 botanical families, and a nutritional analysis of 240 of them set against 22 FAO reference vegetables across nine nutrients — fibre, calcium, iron, zinc, folate, magnesium, vitamins A, C and E. The verdict: 64% of these perennials reach “very high” or “extremely high” levels for at least one of those nine nutrients, and the group that dominates the ranking of species rich in several nutrients at once is woody plants with edible leaves: in 81% of cases, the part you eat is a leaf. In other words: the trees and shrubs whose foliage we eat are, on average, the densest thing the cultivated plant kingdom has to offer.
An honest qualification: most of these champions grow in the tropics — moringa, chaya, cassava leaf. Not all. The study draws up two separate rankings: species that answer the deficiencies of traditional malnutrition — iron, zinc, vitamin A, folate — and species that answer the deficiencies of industrial diets — fibre, calcium, magnesium, vitamins A, C and E. Only ten species appear on both; the authors describe them as “extremely powerful tools” against deficiency. Three of those ten grow here: white mulberry (Morus alba), Chinese toon (Toona sinensis) and grape vine (Vitis vinifera). In all three cases, the part you eat is the leaf.
And they are not spreadsheet curiosities. Martin Crawford has been growing the Dartington forest garden in Devon since 1994 — 0.8 hectare, the world reference in a temperate climate. In September 2025 he published his own list of the best tree vegetables to grow at our latitudes, drawn from use, pruning and taste, with no reference to the meta-analysis tables. In the top three places: white mulberry, toon, grape vine. The researchers’ ranking and the practitioner’s, made separately and for different reasons, land on the same plants.
What is that worth in figures? Sarita Srivastava and her team assayed six white mulberry genotypes, on fresh leaves: 380 to 786 mg of calcium per 100 g — four to eight times spinach —, 4.7 to 10.4 mg of iron, 160 to 280 mg of vitamin C, which weight for weight matches blackcurrant or beats it, and 4.7 to 10 g of protein. Two qualifications that matter: those leaves were grown in India, and they are eaten cooked. A mulberry coppiced in Yvoir will not automatically deliver the same figures.
Why do tree leaves climb so high in the rankings? Nobody has demonstrated it. Martin Crawford offers a hypothesis: woody plants form the closest associations with mycorrhizal fungi, whose mycelium — a tenth the diameter of the finest root — reaches nutrients in the soil that a root cannot. He gives it for what it is, a hypothesis. So do we.
The parallel study by Maayan Kreitzman and Eric Toensmeier on perennial staple crops drives the point home from the other end: maize, wheat and rice do not appear in the densest 15% for any of the nine micronutrients analysed. Not one.
And this is not merely a tropical laboratory effect. Three telling examples, all of which grow here — all expressed per 100 g, the standard unit of food composition tables:
- Nettle. Measured raw, on young spring shoots, by Laban Rutto’s team: 788 mg of calcium and 11,403 IU of provitamin A — carotenes, in the study’s own unit — per 100 g. Spinach, the historic benchmark for a mineral-rich vegetable, tops out around 100 mg of calcium. The same nettle harvested in autumn, or blanched before eating, contains markedly less — season and cooking matter as much as species.
- Wild plants against kale. Philip Stark and his team analysed six wild species against kale, the health-aisle star: kale only stands out on vitamin C. Across all the other nutrients measured, the six wild species generally do better — iron, calcium, potassium, protein and fibre in the lead.
- Blackcurrant. 181 mg of vitamin C in the French Ciqual table, close to four times an orange, which tops out at 47.5 mg. Blackcurrant grows in the shrub layer, in partial shade, in any Walloon forest garden.
Meanwhile, on the annual side, the debate about nutritional depletion is more contested than the usual story suggests. Donald Davis showed in 2004 that between 1950 and 1999, six nutrients out of thirteen had declined across 43 American garden crops, from 6% for protein to 38% for riboflavin. Robin Marles solidly contested the method in 2017: comparing composition tables published fifty years apart means comparing different varieties, soils, laboratories and protocols. He does acknowledge a real “dilution effect” — breeding for yield adds carbohydrate without adding minerals in the same proportion.
One point, however, does command consensus: under elevated CO2, cereals lose nutrients. Samuel Myers established it in Nature in 2014, with 9.3% less zinc in wheat on average. And for rice, Chunwu Zhu’s team measured four B vitamins in decline in Science Advances in 2018 — up to 30% for folate. Only vitamin E increases.
The link between diversity and nutrition
It remains to demonstrate the link we intuitively assume: does eating many different species actually feed you better?
Yes, and a Belgian team measured it. Carl Lachat and his colleagues at Ghent University published in PNAS in 2018 a simple indicator — the number of distinct species eaten per day — applied to the dietary records of more than 6,000 women and children in rural areas of seven countries in Africa, Asia and Latin America. Each additional species raises nutritional adequacy measurably: +0.07 for vitamin A, vitamin C, folate and calcium, +0.05 for zinc, +0.02 for iron. In every season.
Diets far from ours, you will object, and you are right to ask. Except that the same team, led this time by Giles Hanley-Cook, applied the indicator to 451,390 adults in nine European countries — the EPIC cohort, followed for seventeen years. The result: the 20% who ate the most different species show, with comparable profiles — age, smoking, alcohol, education, physical activity, overall diet quality — around a third less mortality than the least diversified 20%. It is an association, not proof of cause and effect, but it points the same way, in the North as in the South. Dietary diversity is not a nicety: it is a nutritional mechanism.
And that is exactly what a food forest builds. A well-tended vegetable garden is nutrient-dense too, and it is not what we are comparing here — but it runs to around fifteen annual species, whereas Coldstream harvests 99 and Ketelbroek has planted roughly 400, most of them edible.
Compare that with the diet the EAT-Lancet Commission recommends in its 2025 report to stay healthy without exceeding the planet’s limits — 300 g of vegetables, 200 g of fruit and 50 g of tree nuts and peanuts per day — and you land on an uncanny coincidence: a food forest produces three of the groups the Commission asks us to increase — vegetables, fruit, nuts — and none of what it asks us to reduce. The two other pillars, whole grains and legumes, remain the business of fields: nobody ever suggested you tear them up.
One figure to make it concrete. A European hazel orchard produces about 1.5 tonnes of in-shell hazelnuts per hectare, or close to 700 kg of kernels once shelled. The recommended ration weighs 18 kg per person per year. In other words: one hectare of dedicated hazel orchard covers the tree nuts of a good thirty people for a year. In your food forest, do not count on that yield: light is shared between the layers, and a hazel in partial shade gives less than a hazel in an orchard. That is precisely a design trade-off — how much full light you reserve for your calorie producers, how much you concede to the canopy.
And there is, in the Coldstream study, a figure worth all the theoretical hectares. The WHO recommends 400 g of fruit and vegetables per person per day. Graham Bell’s garden exceeded that recommendation for close to five people, every day of the year. Not on a hectare: on eight hundred square metres. The size of a large back garden.
What science does not say yet
We need to be clear about the hole in the picture, and it is more precise than you might think. At Coldstream, sixteen species were indeed harvested and sent to the Eurofins Steins laboratory — but to measure water, ash, protein and fat. Macronutrients. The vitamins, minerals and fibre of a real temperate food forest harvest have not been measured by anyone yet. Josefine Nytofte and Christian Bugge Henriksen write it plainly in their own limitations section: the study could also have included a comparison of other dietary components, “such as dietary fibres, vitamins and minerals”. Everything you read above about density therefore crosses per-species composition tables with harvested weights — not analyses run on the baskets that come out of a European forest garden.
It is not for lack of research. The Dutch national monitoring programme, led by NIOO, Wageningen and Utrecht University, follows more than thirty food forests over at least five years — but for soil, biodiversity, carbon, harvested kilos, profitability and social cohesion. Not for nutrients. The citizen tool “Meet je voedselbosoogst” has harvests weighed by the people who grow them — in kilos, not milligrams.
The field is wide open, and it would be a fine thing if part of that work were done in French, on Walloon sites, with laboratory analyses. We are working on it. And if you want to contribute — a lab, a university, or simply a kitchen scale and a harvest notebook — write to us.
What to take away
Our starting argument was half right, and the wrong half was the one we repeated loudest. A food forest does not feed more: it feeds differently — and on nutritional density as on diversity, the data prove it right. Five to six times fewer calories per hectare, but edible leaves — nettle today, mulberry or lime tomorrow — that dominate the nutritional rankings, a blackcurrant worth four oranges, and a Belgian indicator showing, measurements in hand, that every species added to your plate counts. Nobody is suggesting you live off your forest garden alone: we are suggesting you make the rest of your plate better.
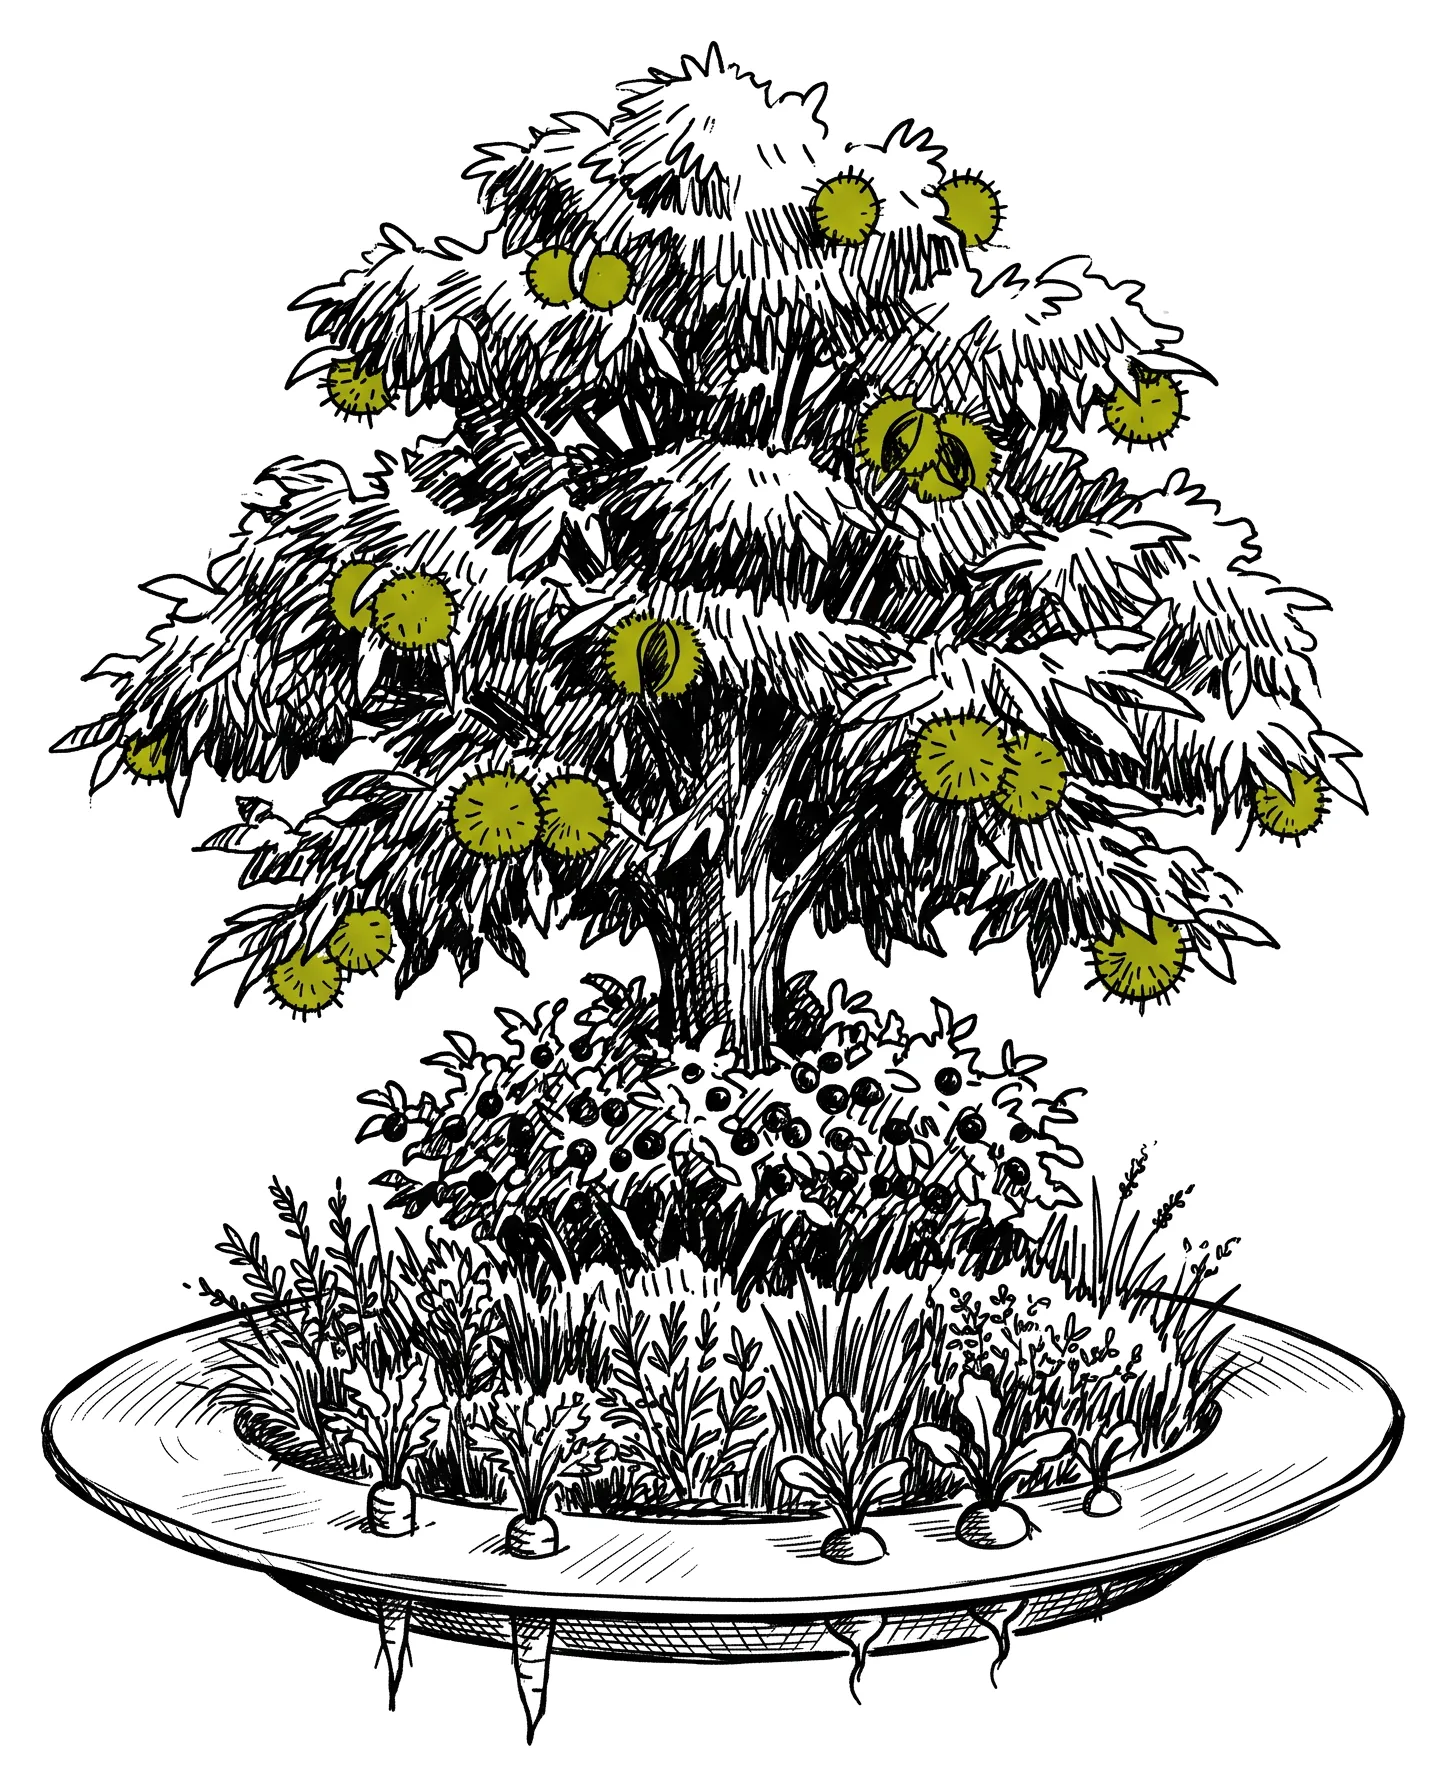
That changes something very practical: the nutritional density of a forest garden is not automatic, it is designed. It depends on the species you choose, the layers you fill, and your decision to eat your trees’ leaves or not. That is exactly what we pass on in the Semisto course — and what we put into practice when we design a project with you.
And if you want to know what a lime leaf tastes like in a salad before planting one: come and visit. We will show you, and we will let you taste.
Sources
Links point to the original publication. Where it sits behind a paywall, the abstract remains accessible and carries the figures quoted here.
- Josefine Nytofte and Christian Bugge Henriksen, “Sustainable food production in a temperate climate — a case study analysis of the nutritional yield in a peri-urban food forest”, Urban Forestry and Urban Greening 45, 126326 (2019). doi.org/10.1016/j.ufug.2019.04.009
- Eric Toensmeier, Rafter Sass Ferguson and Mamta Mehra, “Perennial vegetables: a neglected resource for biodiversity, carbon sequestration, and nutrition”, PLOS ONE 15(7), e0234611 (2020). doi.org/10.1371/journal.pone.0234611
- Sarita Srivastava, Rashmi Kapoor, Anju Thathola and Rajesh Prakash Srivastava, “Nutritional quality of leaves of some genotypes of mulberry (Morus alba)”, International Journal of Food Sciences and Nutrition 57(5-6), 305-313 (2006). doi.org/10.1080/09637480600801837
- Martin Crawford, “Tree and shrub vegetables — the top 5 (or 6)”, The Monkey Puzzler, 7 September 2025. martincrawford.substack.com
- Maayan Kreitzman, Eric Toensmeier, Kai Chan, Sean Smukler and Navin Ramankutty, “Perennial staple crops: yields, distribution, and nutrition in the global food system”, Frontiers in Sustainable Food Systems 4, 588988 (2020). doi.org/10.3389/fsufs.2020.588988
- Carl Lachat et al., “Dietary species richness as a measure of food biodiversity and nutritional quality of diets”, PNAS 115(1), 127-132 (2018). doi.org/10.1073/pnas.1709194115
- Giles Hanley-Cook, Carl Lachat et al., “Food biodiversity and total and cause-specific mortality in 9 European countries”, PLOS Medicine 18(10), e1003834 (2021). doi.org/10.1371/journal.pmed.1003834
- Philip Stark, Daphne Miller, Thomas Carlson and Kristen Rasmussen de Vasquez, “Open-source food: nutrition, toxicology, and availability of wild edible greens in the East Bay”, PLOS ONE 14(1), e0202450 (2019). doi.org/10.1371/journal.pone.0202450
- Laban Rutto, Yixiang Xu, Elizabeth Ramirez and Michael Brandt, “Mineral properties and dietary value of raw and processed stinging nettle”, International Journal of Food Science 2013, 857120. doi.org/10.1155/2013/857120
- Samuel Myers et al., “Increasing CO2 threatens human nutrition”, Nature 510, 139-142 (2014). doi.org/10.1038/nature13179
- Chunwu Zhu et al., “Carbon dioxide levels this century will alter the protein, micronutrients, and vitamin content of rice grains”, Science Advances 4(5), eaaq1012 (2018). doi.org/10.1126/sciadv.aaq1012
- Donald Davis, Melvin Epp and Hugh Riordan, “Changes in USDA food composition data for 43 garden crops, 1950 to 1999”, Journal of the American College of Nutrition 23(6) (2004). doi.org/10.1080/07315724.2004.10719409
- Robin Marles, “Mineral nutrient composition of vegetables, fruits and grains: the context of reports of apparent historical declines”, Journal of Food Composition and Analysis 56 (2017). doi.org/10.1016/j.jfca.2016.11.012
- EAT-Lancet Commission, 2025 report, summary for policymakers — daily intake table.
- État de l’Agriculture wallonne (Statbel) — winter wheat yields.
- Food composition table Ciqual (ANSES) — blackcurrant, orange, spinach.
- Wijnand Sukkel and Martin van Ittersum, quoted in Eos Tracé — comparative yields and labour time.
- Wouter Van Eck, field interview, voedselbos Ketelbroek, 11 April 2026.