What 30 Swedish urban food forests have to say to local councils
Sweden has inventoried its 30 urban food forests. The figures upend the usual pitch and show what a council should actually be funding.
Between 2023 and 2024, a team of Italian and Swedish researchers toured every urban food forest in Sweden: thirty sites across ten cities, from a 30 m² micro-garden to a 5,000 m² edible park (Focacci et al., 2025). As far as we know, it is the first inventory of its kind in Europe. We cross-checked it against eleven other publications — literature reviews, participatory action research, studies with children, yield and carbon measurements, and the case study of the public food forest in Parma. For a council wondering whether a public food forest is worth the money, this is the closest thing to a set of figures from experience. And it does not look like the usual pitch — ours included.
Food production comes last
Marco Focacci’s team asked the people around these gardens — council officers, practitioners, teachers, training centres — to score the services rendered from 1 to 10. Cultural services come first at 8.7/10: educational value at 8.9, recreation and aesthetics at 8.8. Regulating services follow at 7.9/10, led by microclimate and heat islands at 8.5. Food production brings up the rear: 6.5/10.
What an urban food forest gives most is therefore learning, connection and coolness; the fruit comes after. The authors note a contradiction: many say they started out to grow food, then cite social, educational and wellbeing outcomes when asked what the place actually delivers. The harvest is the pretext for gathering more than its accounting purpose.
A second team, with no connection to the first, reaches the same conclusion. Stefanie Albrecht and Arnim Wiek (2021) surveyed 209 food forests across 19 countries. Main service declared: education for 40 % of them, community building for 32 %, food production for 11 %. Two independent inventories measure the same hierarchy — and it contradicts the way these places are presented in funding applications.
What a hectare actually feeds
That ranking is no surprise once you look at the orders of magnitude. The best-documented case is a 0.08-hectare food forest at Coldstream, Scotland, where every harvest was weighed for seven years: 713 kg of food a year (Nytofte and Henriksen, 2019). Scaled to a hectare, that would cover the carbohydrate needs of at most nine adults, and the full energy needs of six. The review by Filippo Oncini and colleagues (2024) reproduces these figures; we checked them against the original, and they match to the gram.
The same review pushes the reasoning to its limit: feeding a city of one million people entirely would require 2,500 km² of food forest. Nobody is arguing for that. A council that sells its project on tonnes of fruit is setting up a public disappointment.
The Copenhagen team that analysed those harvests also counted, tree by tree, the carbon in Martin Crawford’s food forest, planted in 1994 on a Devon pasture: 43.2 tonnes per hectare in living vegetation, where a temperate grassland stores between 4.9 and 12.5 (Schafer, Lysák and Henriksen, 2019; Lehmann, Lysák, Schafer and Henriksen, 2019). The largest single contributor, with 37 % of the tree-layer stock: Italian alder, planted to fix nitrogen rather than for its fruit. These are exactly the quantitative studies the systematic review says are missing.
At Ketelbroek, the pioneering Dutch food forest we visited, harvest sales go through three local businesses — but the site’s main source of income is consultancy and workshops. Wouter Van Eck guided 1,200 visitors there in 2017. Even where production is the stated trade, it is transmission that pays.
The Schaffer thread: twelve farms, a hypothesis, thirty sites
One researcher runs through this whole dossier: Christina Schaffer, a geographer at Stockholm University. From 2012 to 2016 she co-led participatory action research on twelve farms in southern Sweden, each with an experimental 60 m² food forest (Björklund, Eksvärd and Schaffer, 2019). The field conclusion: benefits depend on an analysis of the site’s social and ecological context carried out before planting; there is no universal design.
In 2018, with Jonathan Stoltz, she turned that into a hypothesis: replacing part of the lawns — 70 to 75 % of cities’ green surfaces, expensive to maintain, poor in biodiversity — would strengthen almost every quality that makes a green space restorative. Almost every one: the open view remains the lawn’s advantage, and the authors say so plainly.
In 2025 she co-authored the national inventory. Fieldwork, hypothesis, measurement: the same researcher, over thirteen years.
What makes them spread
The second Swedish lesson answers the how. First the chronology: Sweden’s first urban food forest appears in 2009 in Stockholm, started by a group of citizens trained in permaculture. Schools follow from 2012. Councils only arrive in 2022-2023, with four sites.
Show the data Hide the data
| 2012 (sites) | 2016 (sites) | 2019 (sites) | 2021 (sites) | 2023 (sites) | |
|---|---|---|---|---|---|
| Citizen-led | 4 | 8 | 9 | 9 | 9 |
| Schools and universities | 1 | 1 | 4 | 7 | 17 |
| Councils | 0 | 0 | 0 | 0 | 4 |
| Total | 5 | 9 | 13 | 16 | 30 |
And what made the movement grow, the network analysis shows: six “knowledge hubs” — folk high schools, universities, an NGO, networked professionals — that train and support, some of them for twenty years. 77 % of the people surveyed name these hubs as the driver behind their project; the most central node in the network is a training centre, Stjärnsund.
The most telling figure: between councils, the analysis records no link at all. Zero. Every council that starts out depends on a knowledge hub, because none of them learns from another.
Two empty cells, and they carry the lesson: councils do not talk to each other, and neither do schools. All the circulation of knowledge runs through the knowledge-hub column — the busiest row in the matrix.
Show the data Hide the data
| from ↓ / to → | Councils | Practitioners | Schools | Knowledge hubs | Others |
|---|---|---|---|---|---|
| Councils | 0 | 9 (3/4) | 5 (3/4) | 10 (3/4) | 3 (3/4) |
| Practitioners | 9 (3/4) | 1 (1/4) | 3 (1/4) | 6 (2/4) | 3 (3/4) |
| Schools | 5 (3/4) | 3 (1/4) | 0 | 7 (2/4) | 3 (2/4) |
| Knowledge hubs | 10 (3/4) | 6 (2/4) | 7 (2/4) | 2 (1/4) | 1 (2/4) |
The most central actors in this network are neither the councils nor the gardens themselves: they are places that teach.
What those hubs are to Sweden, Walloon food forest training organisations — ourselves among them — can become here, provided somebody funds that role and not only the plants.
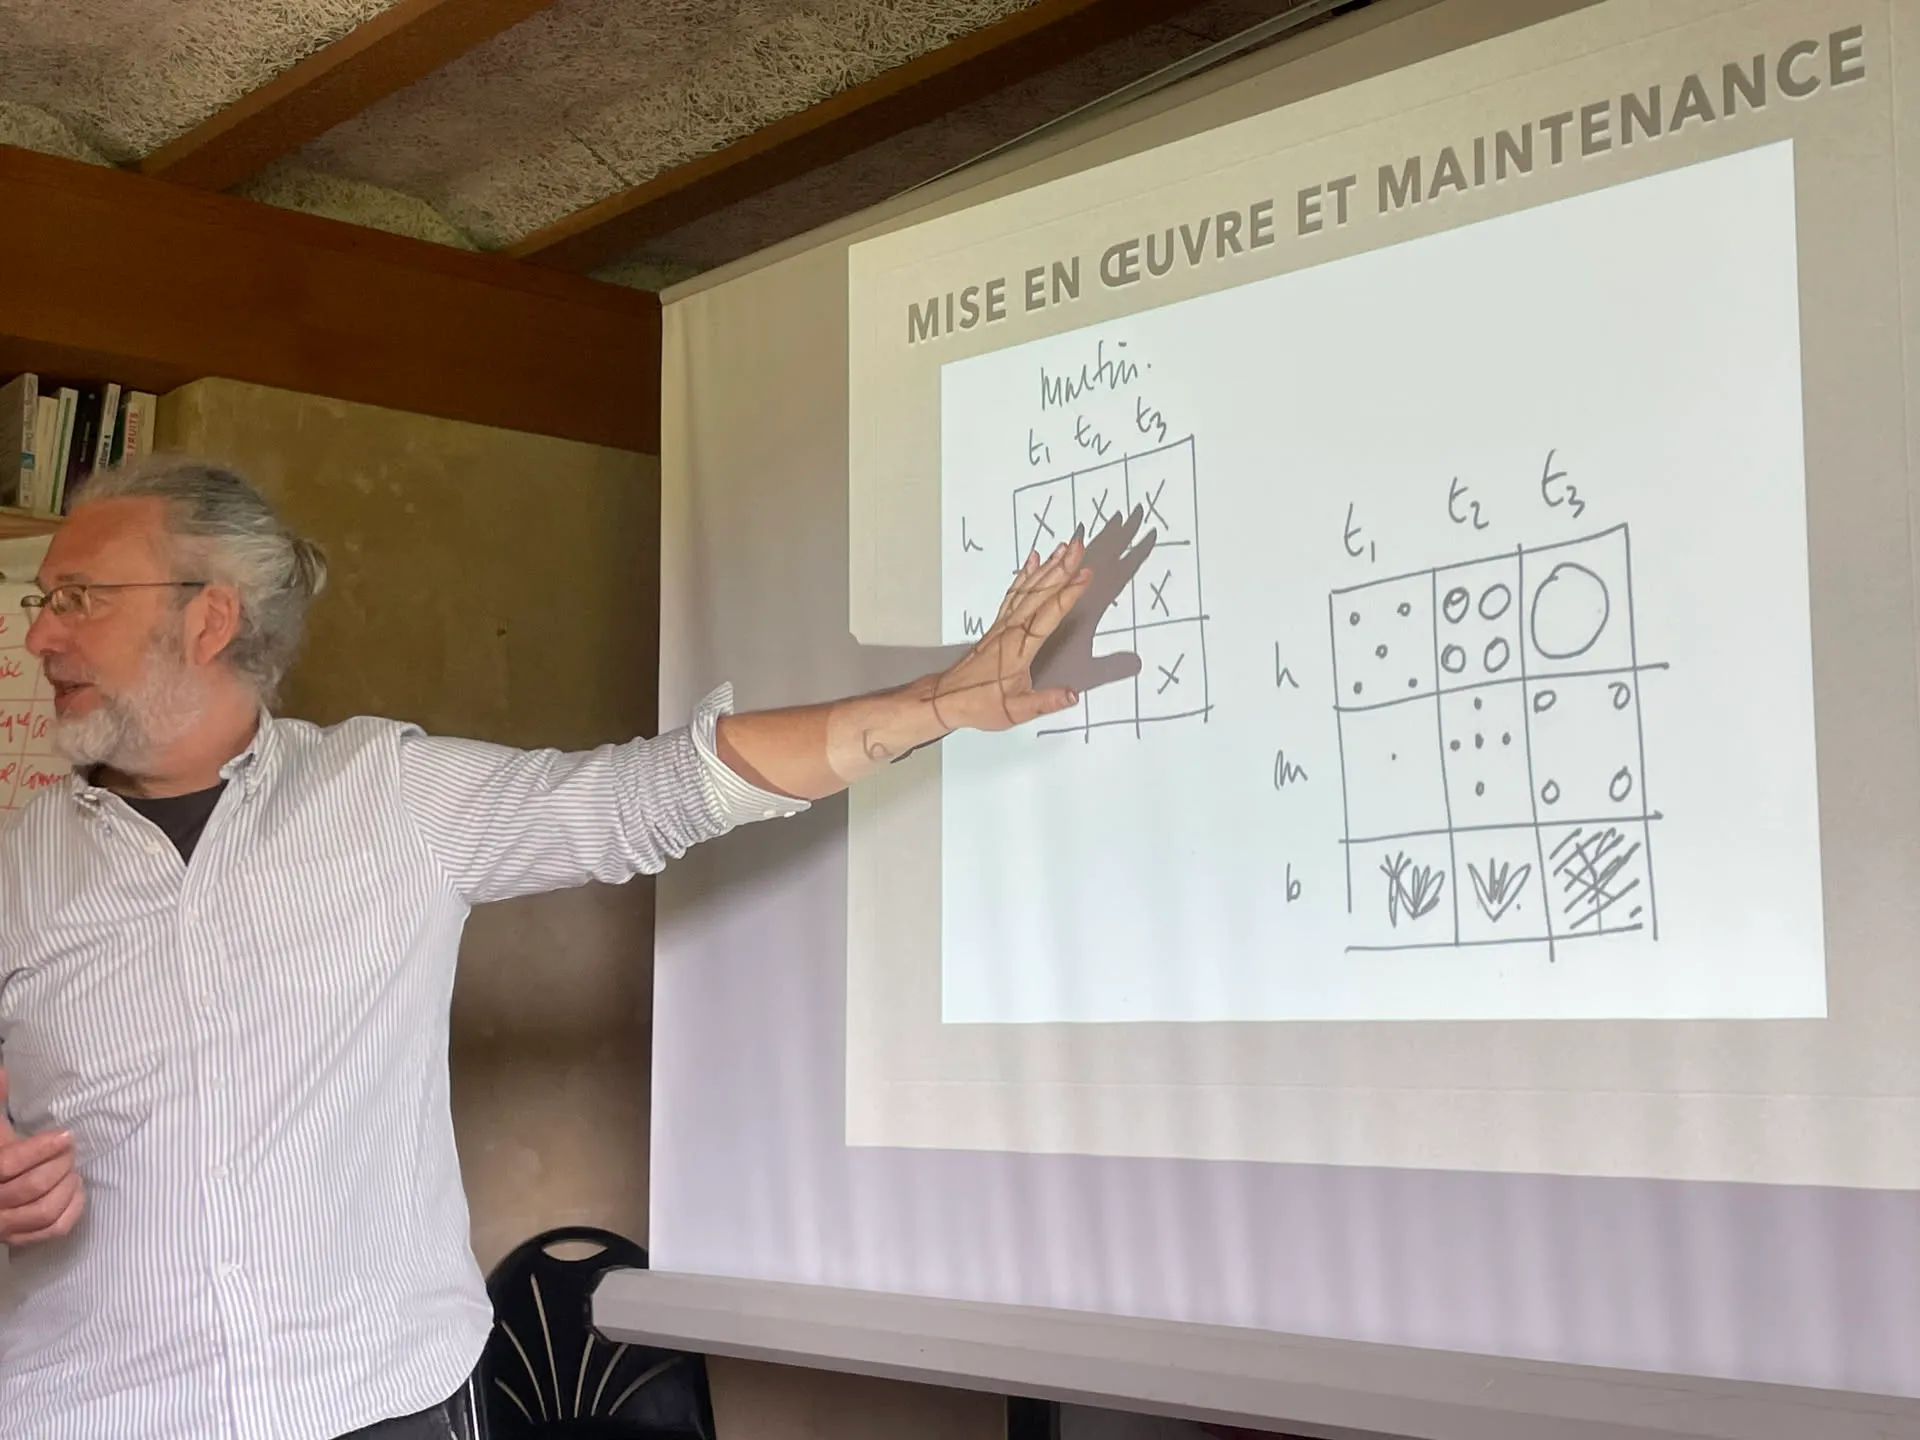
The global study adds one more piece: this transmission has no professional pathway. Beyond generalist permaculture certificates, there is no certified training specific to food forests (Albrecht and Wiek, 2021), even though capacity building is the criterion almost every site studied meets. These places know how to pass on knowledge, and nobody has yet structured the trade.
What schools find there
In 2013, Sweden had a single food forest in educational use: Holma, 5,000 m² (Askerlund and Almers, 2016). Ten years later there are seventeen educational sites, and they carry most of the growth. The mechanism is visible in Gävle, which concentrates thirteen of them: the council directly funds schools’ food forest activities (Focacci et al., 2025). One budget line for facilitation, and the model spreads faster than anywhere else.
What children take from it was studied at Holma itself. Maria Hammarsten and her team (2019) followed 28 children aged 7 to 9, from disadvantaged neighbourhoods, over three years. Three kinds of learning come through in their own words: practical competence — planting, harvesting, building a stone wall —, coexistence and care, and ecological understanding.
This is not our house here, it is the animals’ house.
A detail that meets the missing pathway: Holma’s food forest educators are experienced, but the role requires no diploma and no qualification.
Parma, a public food forest seen from the inside
One city has been showing since 2012 what this looks like once assembled. The Picasso Food Forest in Parma, planted on 4,500 m² of municipal lawn, is the first documented public food forest in Italy (Riolo, 2019). Its author, Francesca Riolo, signs with a single affiliation — Fruttorti di Parma, the citizens’ collective that planted the site and of which she is a founder: here, the knowledge hub and the scientific publication are one and the same.
The institution followed, at its own pace: a petition with more than 500 signatures in a single weekend (2014), a municipal regulation on “active citizenship” in late 2015 that lists food forests among the possible uses of public land, then, in 2017, the city’s acquisition of the land, the first water tap and €50,000 voted through the participatory budget. Transmission came before the framework, and the framework followed.
The obstacles, documented by the same studies
A dossier that says only good things about its subject convinces nobody. These publications do not spare theirs.
On the Swedish side, the three recurring obstacles are legal constraints on land use, financial viability and the shortage of qualified labour (Focacci et al., 2025). Among council officers, the first weakness cited is budget continuity (60 %), followed by the impermanence of the officers themselves (25 %). Among practitioners, barely more than half say they are satisfied with their council; the grievances are financial support (44 %) and land agreements that are too short or too rigid (33 %).
And the two camps do not see the same garden. On five services the gap between practitioners and officers is statistically significant — and it always runs the same way.
The global study puts numbers on the fragility. Of the fourteen food forests Albrecht and Wiek studied in depth, almost all meet the social and cultural criteria. The economic column is the emptiest in the table.
Eight sites out of fourteen do not cover their wages and running costs, and roughly half occupy their land on a precarious or short lease. The sites that manage have diversified their income, and as at Ketelbroek, training often weighs more than fruit sales.
Hannah Thwaites’s systematic review (2025), 121 studies examined, adds the concrete nuisances managers report: roots lifting paving, fallen fruit left unpicked, vandalism, liability for falling branches, allergies. On urban soil contamination, fruit is markedly less exposed to heavy metals than leaves or roots, but everything depends on context: a soil analysis is mandatory before any project in a city. Parma adds the obstacle of perception: layered vegetation is sometimes read as “neglected” next to a mown lawn; the collective answers with mown paths and clean edges (Riolo, 2019).
What a local council can take from this
Put end to end, these twelve publications sketch a specification quite different from the usual reflex of “let’s free up a planting budget and hold an opening”.
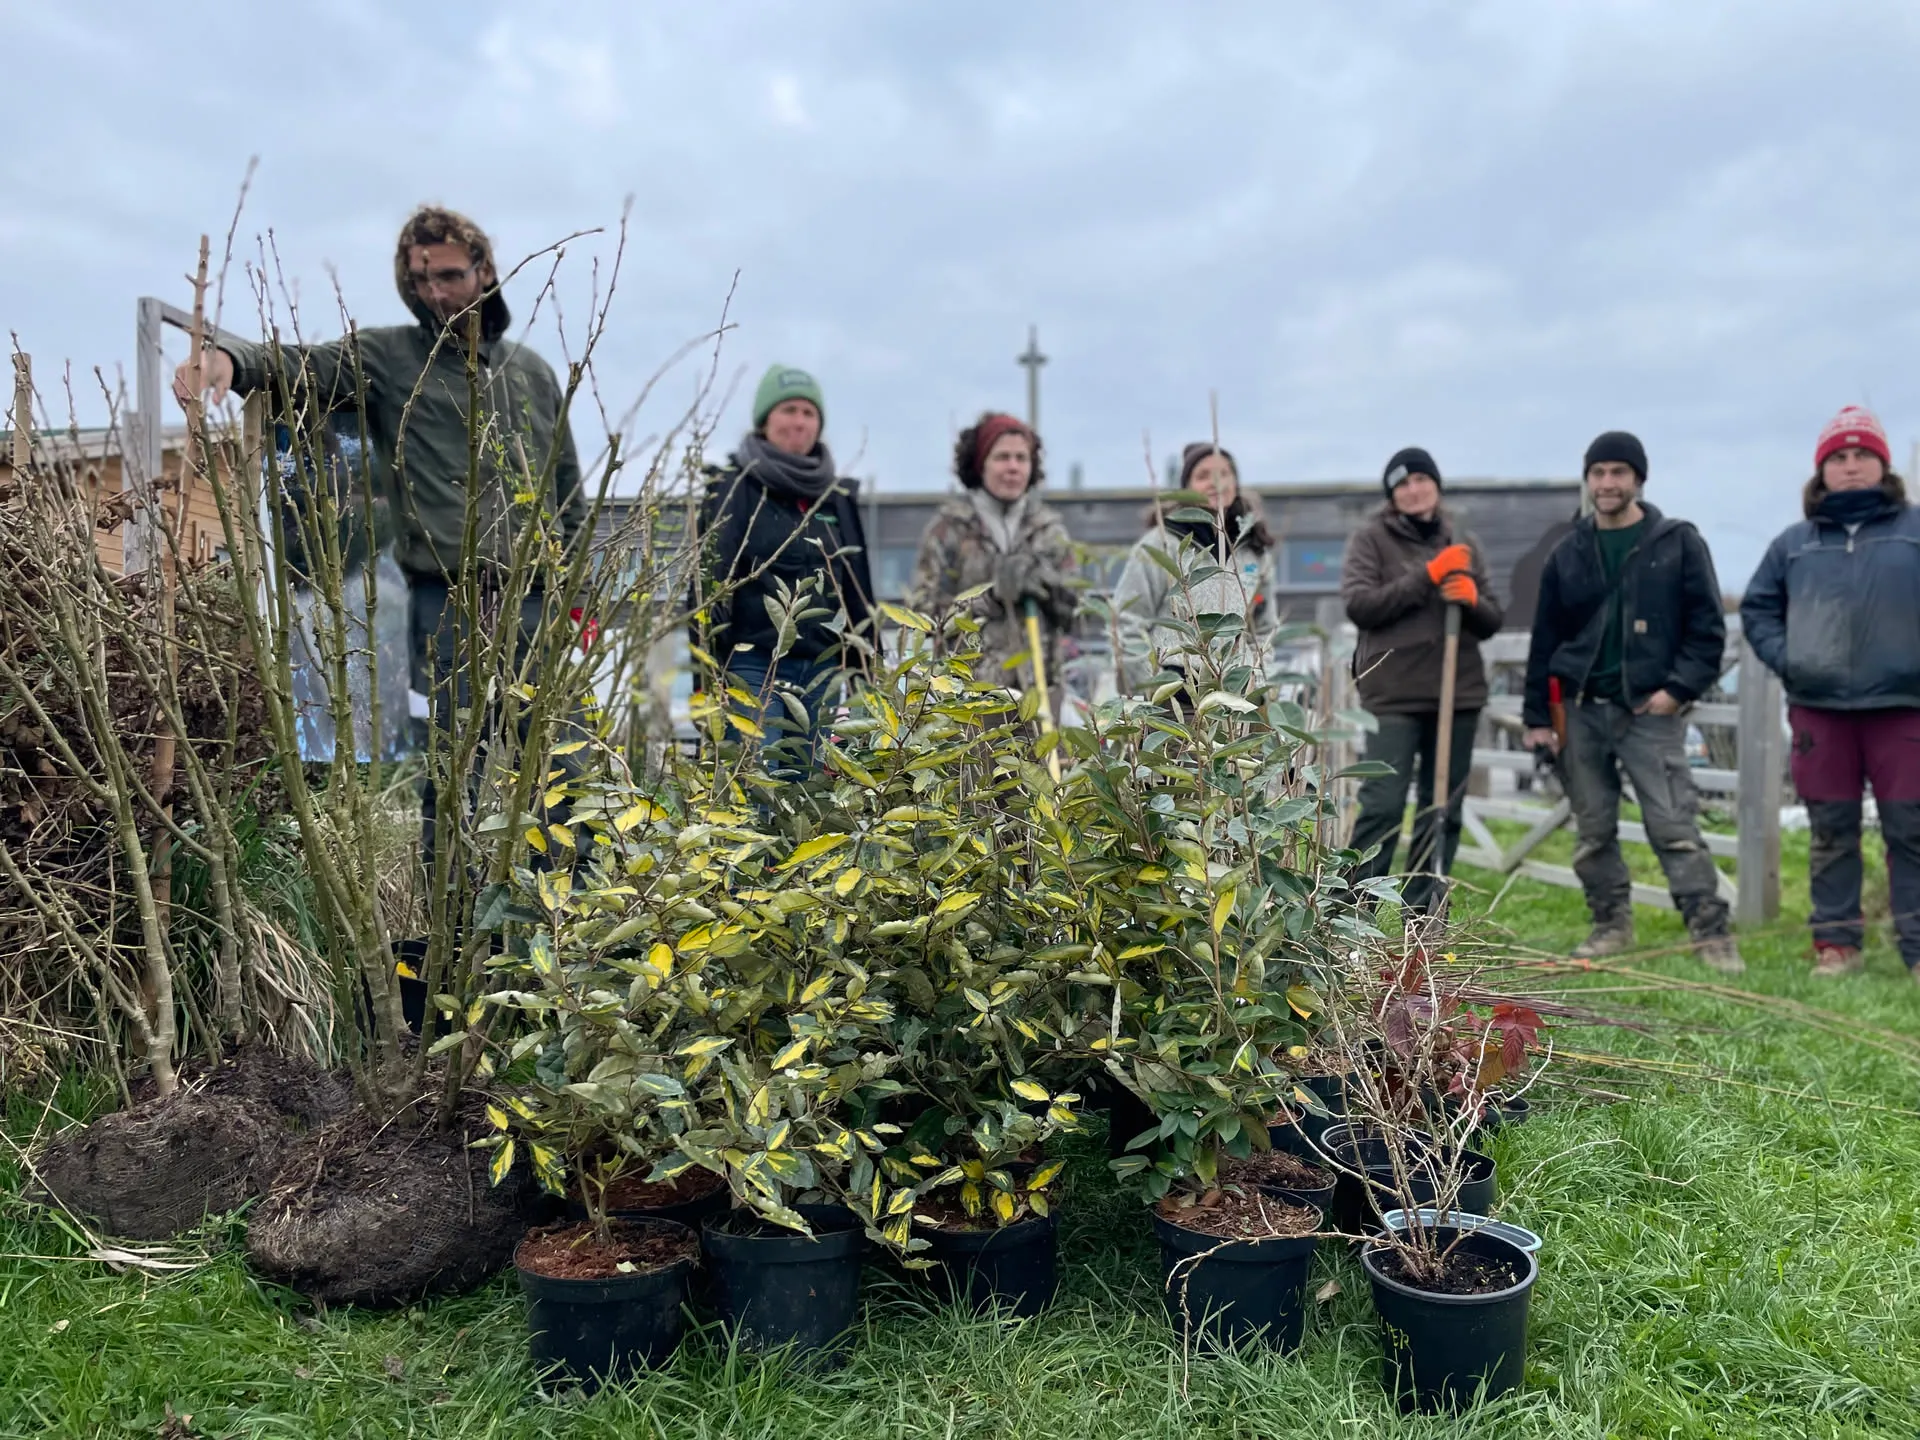
Land first, and it is already there: the lawns. A council does not need to buy a single square metre: converting a fraction of the surfaces it already mows is enough. Before planting, an analysis of the site’s social and ecological context, which the Swedish action research showed the benefits depend on. A long, written land agreement, since lease precarity recurs in Sweden as in the fourteen global cases. Then a transmission operator — the school, the association, the training centre that will run the place — funded on a recurring basis, as Gävle does for its schools: it is the knowledge hubs, not the capital budgets, that make projects spread. A design that accepts the maintenance actually available, simplifying to two layers where qualified labour is short. And measurement from the outset, on soils, biodiversity and visitor numbers, to document what the literature cannot yet quantify.
This is the approach we propose to local authorities in our offer for towns: treating the food forest as infrastructure that is planned, budgeted and passed on. If your council is considering it, write to us — we will come and talk it through, Swedish figures in hand.